

")
By Ee Hsin Kok. Edited by Arjun Chandrasekar.
Overview
The moving average is a popular indicator used to analyze the price movements of a particular stock or equity. It aggregates past prices in order to define trends. Today we’ll be discussing how it works, the different time periods it can be used on, its different variations, and how you can use it.
How It Works
The moving average(MA) is calculated by taking the average of the last n closing prices, where n represents the period of the moving average. For example, if a stock’s last 3 daily closing prices were $116, $118, and $120, then the 3-day moving average would be at $118 since that’s the average closing price of those 3 days:
($116+$118+$120)3 = $118 ← The Average.
Time Periods
As mentioned above with the example of n, moving averages can give different values based on the time periods they are used for. Common time periods used for moving averages include the 20,40, and 50 for the shorter term; and 100, 150, and 200 for the longer term. Some traders or investors choose to stick with 1 moving average, while others may have multiple. If you choose to use multiple, it’s a good idea to vary your time frames across different lengths. Instead of using a 40 MA and a 50 MA, you might want to use a 20 MA and 50 MA, or a 50 MA and 100 MA instead.
Variations
There are also many different types of moving averages. The formula shown above applies to the simple moving average (SMA), but there are a few other variations. For example, there is the exponential moving average (EMA), which places greater weight on the more recent price points and less on the older ones. This allows it to respond quickly to the latest price movements, which might fit the needs of shorter-term traders. Two other notable moving averages are the weighted moving average, and the smoothed moving average. We’ll leave it to you to check those out!
Utilizations
The easiest way to use moving averages is to use them as an indicator of trends, as well as to identify possible support levels.
For example, this is a daily chart of Google with a 50 SMA (Blue) and a 150 SMA (Green):
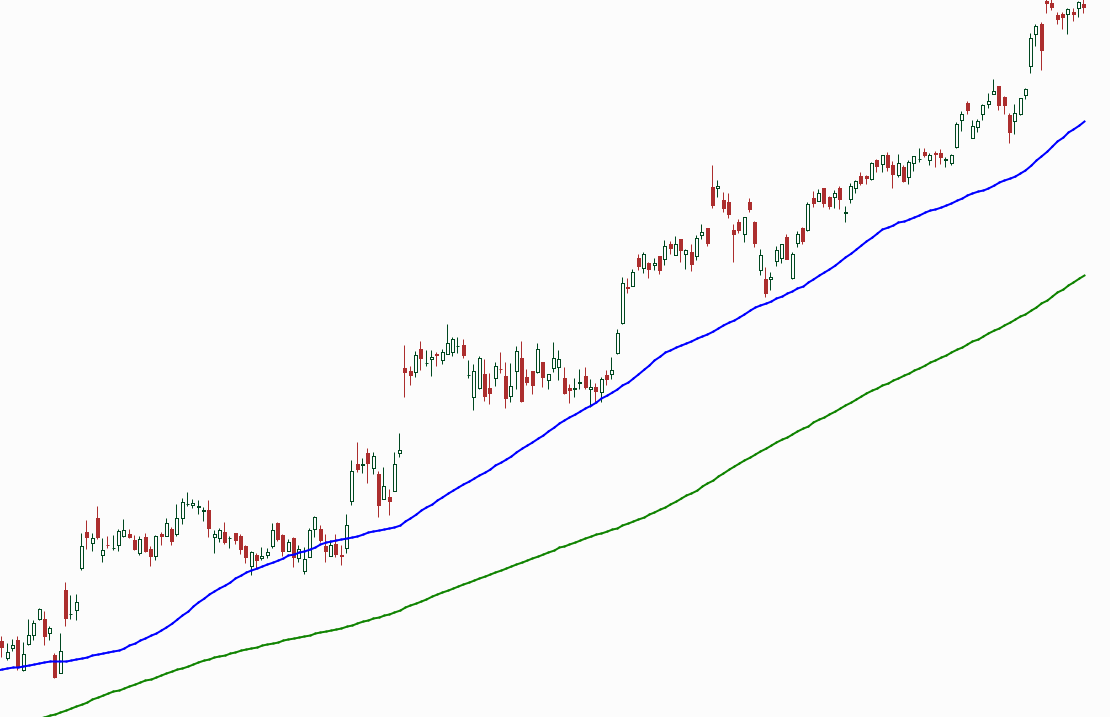
From this chart, the moving average can tell us two things:
- Since the 50 SMA is above the 150 SMA, they are both sloping up, and the price is currently above both MAs, the direction of the trend is upward for both the short and medium-term.
- The prices appear to bounce at the 50 SMA, telling us that the 50 SMA might be a good support level for this upward trend.
Conclusion
In this article, we introduced the moving average indicator and went over how it works and how to use it. The moving average is a great indicator to add to your arsenal because not only is it easy to understand, but it’s also an effective indicator for defining trends, and the bedrock of many advanced strategies. So put it to practice in the hopes of mastering it, because if you do, it can be a very powerful tool!


